Update 01/12/2011: do read the comments! lots of good stuff below this post.
So yesterday, I was having a relatively laid back day, rolling about the living room with the bairns, occasionally seeing what was happening on the twitters. A few people were retweeting How To Design Your Own Infographics and I thought "hey, I should make an infographic." I concede that the world does not need any more infographics, but its just my line of work that it pays to play and tinker with these kind of things, before we start talking about them in class. What should I make an infographic about? I thought. Digital Humanities, of course!
But then you run into the problem... where are the stats about Digital Humanities that could be used for such a thing? There is nothing about it on the (problematic) wikipedia page, and facts and figures arent terribly close to hand. Now, I may never get round to making that infographic, but it would pay, I think, to start to gather up information about our discipline. Here is a list of some things I have come up with - or at least, could track down pretty quickly. I also asked the twitters, so have credited some people, below, who were quick to answer.
The growth in interest could be charted by the growth in subscriptions to the Humanist discussion list, 2002 onwards, which is available here, although Willard would have to be prodded for the more up to date figures, or they could be gleaned from the AHDO minutes from the past few years. (Willard has emailed me stats - current subscription is 1831 on the list!).
Update: Willard has provided me with the number of posts to humanist over the years:
Year Messages
1993-4 646
1994-5 489
1995-6 775
1996-7 919
1997-8 727
1998-9 617
1999-2000 576
2000-1 841
2001-2 640
2002-3 668
2003-4 847
2004-5 776
2005-6 765
2006-7 610
2007-8 680
Willard has also supplied the number of members of the list:
year members
2003 1385
2004 1300
2005 1383
2006 1458
2007 1537
2008 1650
2009 1359
2010 1518
2011 1831
Lou Burnard has also pointed me to a report he made about early use of Humanist, between August 1987 and January 1988. There are some crucial stats there about both individuals and topics in that period. As Lou says... "I leave it to the reader to determine whether anything much has changed".
The number of submissions to the DH annual conference (formerly ALLC/ACH), compared with the acceptance rate, could be gathered, from the ADHO minutes. (I'm digging on this. Paul Spence has told me there are just under 400 submissions for dh2012).
John Unsworth gave me the keys to the kingdom to generate the stats from conftool myself:
| long papers | accepted | %accepted | |
| DH2007 | 90 | 68 | 75.6 |
| DH2008 | 156 | 95 | 60.9 |
| DH2009 | 210 | 114 | 54.3 |
| DH2010 | 231 | 86 | 37.2 |
| DH2011 | 122 | 53 | 43.4 |
DH2011 was the first conference to have short paper formats in addition to the long papers: 57 were submitted. 21 of those were accepted, which was an acceptance rate of 36.8%. (Thanks, Matthew Jockers for the prod on that one).
The number of people on twitter identified as Digital Humanities scholars, in Dan Cohen's comprehensive list. (It currently stands at 359 individual scholars doing Digital Humanities who are on twitter).
Rachel Murphy pointed out that 46 phd students are currently enroled in the Digital Arts and Humanities PhD Programme in Ireland.
The number of people subscribing to Literary and Linguistic Computing, which means they are part of at least one membership association tied to the Alliance of Digital Humanities Organisations, and the individual numbers for ALLC, ACH, and Sedi/semi. Dave Beavan has responded: as 2 Nov 2011 @LLCjournal subscribers: ACH 89, ALLC 78, SDH-SEMI 36, joint 172. Total is 375! (will dig out historical figures to show the trajectory).
Update: here is a table showing the growth in membership of ADHO through subscription to LLC, culled from Dave and I's membership reports:
| type | Nov-07 | Nov-08 | Nov-09 | Nov-10 | Nov-11 | ||
| ACH | 73 | 57 | 87 | 76 | 89 | ||
| ALLC | 84 | 72 | 82 | 84 | 78 | ||
| SDH/SEMI | n/a | 13 | 17 | 39 | 36 | ||
| Joint | 67 | 92 | 121 | 115 | 172 | ||
| Total | 224 | 234 | 307 | 314 | 375 | ||
Edward has also provided some statistics regarding the home countries of authors who submit to the journal:
In 2011, the breakdown of the submitted papers per country shows that although most submissions come from Europe (81) and the US & Canada (27 & 14), Asia isHe also provided an overview of growth of total submissions to the journal:
following with 22 submissions. There is potential growth in South America (3), the
Arab world (3), Africa (2) and Australia (1).
2008 (65), 2009 (47), 2010 (41), 2011 (123).
The acceptance rate for papers submitted to LLC in 2010 was 54.84% coming down from 63.16% in 2009 and 71.70% in 2008. The acceptance rate for 2011 is 55.10%.
The annual hits and downloads to LLC online are thusly:
| Home Pages | TOC pages | Abstracts | HTML Full-text | PDF Full-text | Total Full-text | |
| 2008 | 32,413 | 13,120 | 93,619 | 6,109 | 17,404 | 23,513 |
| 2009 | 24,793 | 13,511 | 92,685 | 8,226 | 21,775 | 30,001 |
| 2010 | 28,644 | 15,341 | 101,649 | 7,476 | 20,770 | 28,246 |
| 2011 ytd | 36,096 | 15,811 | 111,759 | 8,350 | 20,172 | 28,522 |
A list - and $ total - of all the grants that the National Endowment for the Humanities, from the Office of Digital Humanities. This is via @brettbobley. I'm getting a total of 250 projects, with an outright award of $15,268,130 total (although I'm doing this on a tiny screen, so do correct me if I'm wrong, I need to see the spreadsheet on a much larger monitor to make sure that is correct!).
wow. thats a lot.
The list - and $ total - of the joint NEH and JISC grants awarded for Digital Humanities projects (via @brettbobley, and @alastairdunning ). I'm getting 8 projects with an outright award of $966,691 (although again, teeny screen and large spreadsheet issues, do check my working).
There is a list here of 330 projects funded by the AHRC between 1998 and 2004 that had some form of digital output. They dont include the funding amounts in the spreadsheet though (why? scared?) - I contacted them, and Ian Broadbridge, Portfolio Manager for the AHRC, provided me with this information
A list of AHRC-funded digital research resources is available on line at http://www.arts-humanities.net/ahrc. As you can see, it includes a wide range of browsing, sorting and filtering options, and connects to detailed information about each project, including content type and methods used. A report on this site gives a some brief statistical information about the costs of the projects involved. All these DRR projects also represent a significant investment of public money, to a total cost of approximately £121.5m across all the years and schemes covered. Taking, once again, Standard Research Grants for the years 2000-2008 as the more reliable basis for illustration, we can see that the average cost of DRR projects is significantly higher than that of all projects in this group taken together: £309,110 as against £232,948. The average costs increased substantially from 2006 because of the move to full-cost funding: in 2008 the respective figures for Standard Research Grants were £413,838 and £324,703: the cash difference remains in line with the overall figures, though the proportional difference is reduced as a result of a larger overhead element. The ICT Methods Network Award was £1,037,382 The Award amount for the ICT Strategy Projects is £979,364 The Award Amount for e-Science Workshops is £65,498 The Award amount for Research Grant (e-Science) is £2,014,626 The details of all of the individual value of the grants is obtainable from http://www.ahrc.ac.uk/FundedResearch/BrowseResearch.aspx
There is also a review, by David Robey, of the AHRC ICT Programme here.
The Andrew W. Mellon Foundation fund a large amount of projects in the Humanities which have a digital component. Their Scholarly Communication and Information Technology strand of funding paid $30,870,567 to projects in 2010 (gleaned from their grant report). I'm asking about previous years, as their reports work differently across other years.
Lisa Spiro identified 134 courses in Digital Humanities worldwide in her 2011 paper at DH. This can be compared to the 9 institutions offering courses in 1999 from McCarty and Kirschenbaum's overview of Humanities computing units and institutional resources in 1999, which I had to claw from the wayback engine. This needs a closer looking at, to see what comparisons can be made.
Mark Sample has been charting the growth of Digital Humanities sessions at MLA over the past few years. 2010: 27, 2011: 44, 2012: 58/753.
Alastair Dunning suggests we could look at http://
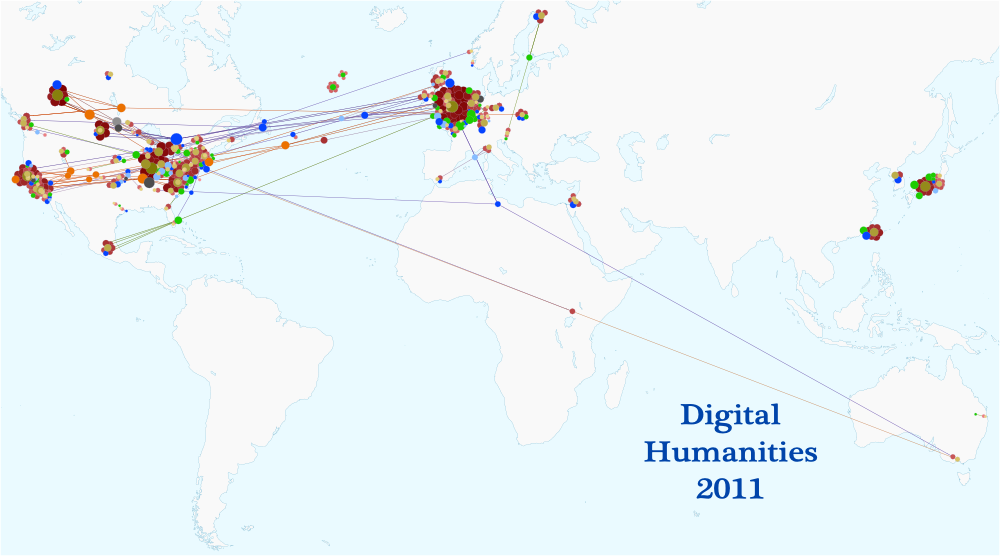
There is the uber cool Network Visualisation of DH2011 which could be used to generate some useful stats, such as where everyone who came to DH2011 came from. which I have used above in this post. This was created by Elijah Meeks.
Centernet - an international network of Digital Humanities centres - "has over 200 members from about 100 centers in 19 countries".
Kristel Pent has pointed out that there is another list of centres of Digital Humanities on the ALLC pages, and these should be cross referenced with the list on Centernet.
Bethany Nowviskie has posted over at DH answers that there were:
28,837 unique visitors to DH Answers in the first year
from 164 countries
969 registered DH Answers users
contributing 1387 posts on 223 topics
And here are the numbers of Humanities Computing / Digital Humanities-related sessions held at MLA -- by count of the ACH: http://ach.org/mla-pages
1996: 34
1997: 34
1998: 45
1999: 42
2000: 59
2001: 55
2002: 44
2003: 36
2004: 39
2005: 37
2006: 48
2007: 56
2008: 65
________
604 panels over 13 annual conventions
Fred Gibbs did a lovely post categorizing Definitions of Digital Humanities, which would make a nice pie chart.
Dave Beavan suggested looking at the numbers of people contributing to the Day of DH, but the server always seems to be down. I'm emailing real people instead.
Peter Organisciak has provided me with the stats re those who registered for the Day of DH over the past few years:
Day of DH 2009: 103 Registered (83 participated) Day of DH 2010: 154 Registered Day of DH 2011: 244 RegisteredThere are some interesting visualisations of the Day of DH up there, too.
James Cummings tells me there are 700 subscribers to the Digital Medievalist Discussion List. Further details: DM-L started in 2003. 15th Jan 2005 there were 306 members, 28th April 2010 537 members, 27th August 2011 672 members, 5th December 2011 700 members.
There are also 584 followers of the twitter account.
James also gave me access to the user statistics of the Digital Medievalist website:
in 2011 there were 16,808 Visits, from 12,763 Unique Visitors, with 35,546 Pageviews. 25% were returning visitors.
James also gave me access to the stats for the Text Encoding Initative's website:
in 2011 there were 176,469 Visits from 107,320 Unique Visitors, with 537,750 Pageviews. 40% were returning visitors.
Syd Bauman tells me there are currently 949 people subscribed to TEI-L.
Gabriel Bodard tell me there are currently 374 subscribers to Digital Classicist email list.
Leif Isaksen has told me the subscriber counts to Antiquist discussion list:
Aug 2006 - 3 Jan 2008 - 180 Jan 2010 - 264 Dec 2011 - 330@DHNow has 2676 followers on twitter. @Dancohen has told me that
last month the DHNow website had 14.5K visits from 5K unique visitors, and 48K page views.
@DHquarterly has 688 followers on twitter. A quick look at google analytics tells me that in the past 6 months (when google analytics was switched on in DHQ) there have been 23,636 visits from 15,547 Unique Visitors who have looked at 52,370 pages in total (average of 2 and bit pages per visit). There have been visits from 137 different countries.
@LLCJournal has 513 followers on twitter.
Boone Gorges provided me with some stats about the code behind Anthologize - code lines, files, and commits another great way to measure intellectual investment in DH! (It was Bethany Nowviskie who suggested this, actually). There are 61 files, with 8693 lines of code, and 1722 comments. That's some programming.
Ray Siemens has provided me stats about the Digital Humanities Summer Institute:
DHSI people stats: 2012 (300+ confirmed so far), 2011 (230), 2010 (180), 2009 (150), 2008 (125), 2007 (115), 2006 (95), 2005 (80), 2004 (75), pre-2004 (35-40 at each offering). 540 twitter followers @DHInstitute, 1429 members on the email announcement list.Elisabeth Burr has told me that the European Summer School "Culture & Technology" at Leipzig had 85 students in 2009, and 2010, and 21 lecturers, from 21 different countries
(Brazil, Burkina Faso, Germany, Finland, France, Great Britain, India, Ireland, Israel, Italy, Canada, Netherlands, Austria, Poland, Serbia, Spain, Turkey, Ukraine, Hungary, USA, Cyprus)
Julianne Nyhan has provided me with stats about the Computers and the Humanities journal (commonly known as CHum) which ran from 1997 to 2004.
There were 1244 papers published in total, from 811 single authors, and 433 joint authors.
What other facts and figures exist about DH? I'm looking for some other stats that "exist" - ie, dont tell me "count all the projects that say they are DH!" - erm, yeah. Tell me the count, and how you worked it out. Otherwise its a research project, rather than a "grab the existing stats" thing, which we should, as a community, be able to do, right? right?
I'll ask the twitters, and DHanswers, but if you tweet me or message me or leave a comment here, I'll update the list, above. Maybe someone will make that infographic...
Update: Desmond Schmidt did an analysis of the jobs posted to Humanist
"There have been a lot of advertisements for jobs lately on Humanist.
So I used the Humanist archive to do a survey of the last 10 years.
I counted jobs that had both a digital and a humanities component, were
full time, lasted at least 12 months and were at PostDoc level or higher".
2002: 11
2003: 6
2004: 15
2005: 15
2006: 18
2007: 24
2008: 27 (incomplete - 1/2 year)
2009: 36
2010: 58
2011: 65 so far
Breakdown by country:
US: 133
GB: 65
CA: 35
IE: 18
DE: 13
FR: 8
IL: 3
NO: 2
NL: 2
ES: 2
AT: 1
AU: 1
BE: 1
Normalised by population:
IE: 4.0
GB: 1.051779935
CA: 1.038575668
US: 0.433224756
NO: 0.416666667
IL: 0.405405405
DE: 0.158924205
FR: 0.127795527
NL: 0.121212121
AT: 0.119047619
BE: 0.092592593
AU: 0.04587156
ES: 0.043572985
You can also see the Digital Humanities job trends from indeed.com but the percentages are so small I'm not sure its statistically worth including.
19 comments:
There's a also a list of UK Digitisation Projects (up to 2009) at
http://www.peelingwall.org/uk-digitisation.html
This is digitisation rather than DH projects, and does not include projects funded under the AHRC Research Grants scheme (which tend to be hidden)
Thanks Alastair!
Thanks Melissa. I too will try this. I suppose it depends on that slippery definition discussion of digital humanities (ie. research vs utility as Alistair hints at etc.).
I would like to do a similar project here; but not sure what metrics to use and what can be measured. I wonder have other epistemic practices done this?
This is terrific!
One quick comment: One of the key DH funders is the Andrew Mellon Foundation. (They are US based but also fund international projects.) I don't think they have a list of their DH funded projects, per se. So teasing out that data will be more difficult. But if you feel like digging into it, they do list all their grants in their annual reports.
See:
http://www.mellon.org/news_publications/annual-reports-essays
Google trends for digital humanities is interesting. According to Google, only recently have people started looking for digital humanities in large enough numbers to detect. http://www.google.com/trends?q=digital+humanities&ctab=0&geo=all&date=all&sort=0
More about centerNet: there are 247 people currently on its listserv and member centers come from 26 countries.
Hey, Melissa, I added some numbers to your posting on DH Answers. Some were meta: number of DH Answers users, unique visitors, countries of origin, posts... -- and I also counted up 13 years' worth of MLA convention sessions on DH-related topics, as chronicled by the ACH.
If you consider THATCamp to be a digital humanities meeting (there are arguments for and against that), here are some THATCamp stats:
1 THATCamp in 2008
3 THATCamps in 2009
17 THATCamps in 2010
26 THATCamps in 2011
23 THATCamps (so far) planned for 2012
70 attendees on average per THATCamp
1899 registered users on http://thatcamp.org
57% of respondents "strongly agree" that THATCamp was useful for them
37% of respondents "agree" that THATcamp was useful for them
2% "neither agree nor disagree" that THATCamp was useful for them
4% "disagree" that THATCamp was useful for them
There's a list of subject keywords associated with DH conference paper/poster/panel submissions which AFAIK has been in place and presumably added to over the years. It would be very interesting to track the distribution of submissions across these headings over the years.
Along these lines, it would also be very interesting to see what percentage of registered attendees at the DH conferences also attended the previous year's (or 3 or 4?) conference(s) and which subject keywords were associated with the attendees who were coming back year after year and who was not.
Similarly, the subject keywords associated with accepted papers and those of rejected papers.
The general idea is to try and use this as a way to track what kinds of disciplinary drifts have taken place in the DH world - so, for example, a slow and steady move away from the dominant position of English literature (or not) or a slow drift towards a greater inclusion of visual media.
Come to think of it, it may be a good idea to revisit the DH conference subjet list. There may be some value in replacing it instead with the list drawn up by http://www.arts-humanities.net/
One more idea.. download/"readership" stats from DHQuarterly and LLC. FWIW I can offer them for articles on http://jdhcs.uchicago.edu
Thanks for all these comments!
I am chasing up all of the leads for ready stats...
m
ps yes, Arno, do post stats from access to the colloquium papers!
I've uploaded an Excel spreadsheet (.xls) to my Dropbox account:
http://db.tt/BE7q0vmO
OJS offers stats on Abstract, HTML and PDF views of an article. JDHCS doesn't (with one or two exceptions) publish articles in HTML format so the column "Total Galley Views" is in effect the same as PDF views (i.e. downloads).
Feel free to repost and re-use. The data is current as of Dec. 12th. 2011.
@Arno, really interesting stats. Most papers getting really good readership! Tell me, do you have an overall figure for the whole collection of papers, number of unique viewers to the site? I cant tell from the stats you give whether its the same readers reading a lot, or different ones, you see.
Yes, that would be good to know. Short answer, unfortunately, is that I don't have good numbers for either of your questions.
Longer version is that the OJS stats don't offer a vistor focused perspective (though no doubt it could be tickled out from the raw web logs). And as for total viewership.. JDHCS runs on letterpress.uchicago.edu (which also hosts another OJS journal) and was recently moved to a VM so the available stats are incomplete and somewhat inaccurate: http://bit.ly/tfYWkH Chicago has Google Analytics would be better for this and its running on the site as well but for whatever reason it's (I've been told) not capturing visitors properly.
These stats are basically UK-US based (and biased) and the result is a colonial-style infographics. They almost totally ignore the huge amount of DH work done in other countries (i.e. Italy, Spain, Portugal, France etc.). It would not be a bad idea if some of the ALLC / ADHO / TEI people would start reading (in) other languages. It is so sad to see how self-centered the anglo-american world of DH has become these days.
Namasté.
@dominguero, thanks for your comments. Yes, the stats are mostly from UK and USA. These are the ones that I have been able to find. Tell me, instead of complaining, why dont you do something productive, and provide me with some stats that are from beyond the UK or USA? Why dont you do some legwork? I have made it clear that I am interested in ALL stats that I can get, and if I cant get stats from beyond the UK or US - is that my fault? its as much your fault as mine, please suggest something constructive rather than dismissing the whole activity. I would welcome constructive insight - I am not so taken by people who just complain and dont suggest a way forward.
and actually, @dominguero, thinking about your comment - in what way is twitter, or website stats just linked to the us/usa? When we say there are 167 countries featured, etc - in what way is that saying its just the us/usa? I wasnt aware that online activity was just the us/usa - so I think your comments are a little groundless. Thanks for stopping by, but do give me something to work with, rather than making snark.
Dear Melissa, I promise I will be "constructive" as soon as you will admit that you have misrepresented the international scenario of DH/HC. I think it is your problem to provide grounded info, not mine, as you presented your work as a "survey" of Digital Humanities.
Actually, the info and data are out there: just search the Net with words like: Humanidades Digitales, Digitale Geisteswissenschaften, Informatica Umanistica, etc. Being a native English speaker can be a privilege, but it's not an excuse.
If you look at the data for Internet access you'll discover that users in the western world (Europe and the U.S.) represent only the 35.7% of the total
Finally, before starting a survey, you need a methodology. It doesn't seem you have got one: what you have, instead, is a pile of data arranged nicely. Cheers
Post a Comment